This tutorial will cover how to create a summary report based of your students in SAM. This report will group and total your student records with the intent to derive meaningful and insightful data.
Summary reports can be used for:
- Fetching all active students
- Comparing the quantity of student accommodation types.
- Seeing the quantity of pending test request.
- and much more.
Note:This tutorial will provide a brief walking through of creating a summary report based on Students. Of course in SAM gives you the ability to create a report based on any table. But to better serve disability service providers this tutorial will cover the most common report request. If you would like a more detailed tutorial on creating summary reports, click the link below.
https://help.quickbase.com/user-assistance/creating_a_summary_view.html
To begin:
- Navigate to the Students table located on the Menu bar.
- Click on Reports & Charts dropdown and select the + New button.
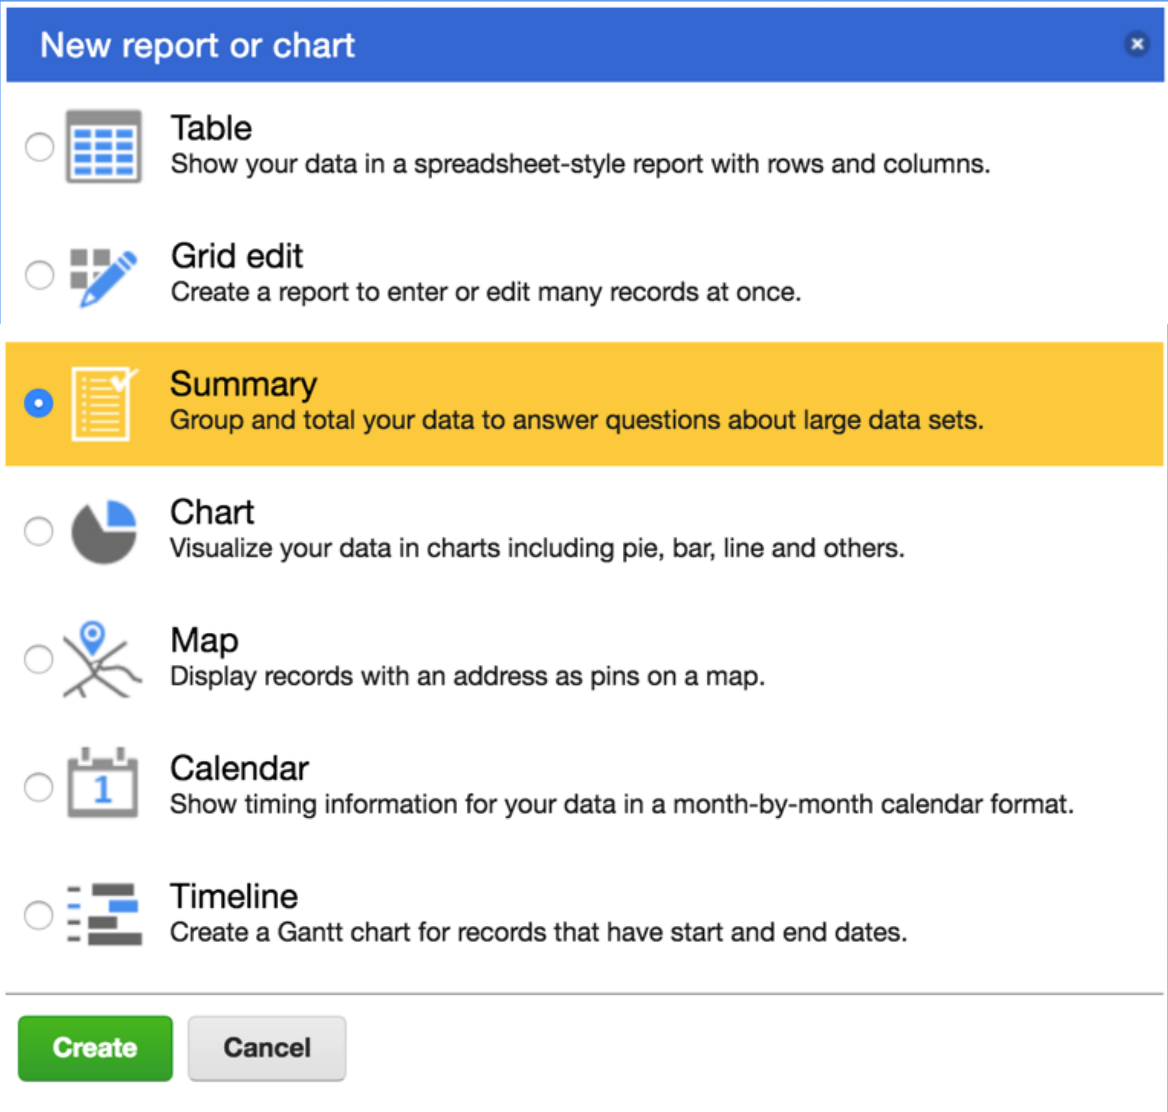
- A dialog box will appear prompting you to select a type of report. Select Summary.
Main Configuration
Use the section named "Basics" to give an appropriate name and description to your Student summary report.
Under the section named “Summarize Data,” make sure ‘# of Students’ is selected for the Summarize dropdown (this should be default). Next to this selection in the dropdown labeled 'Display As', gives you options for representing the summary.
- If you would like to represent your student totals as a simple count, select "normal value."
- If you would like to represent your student totals as a percentage of a whole, select "percentage of column total".
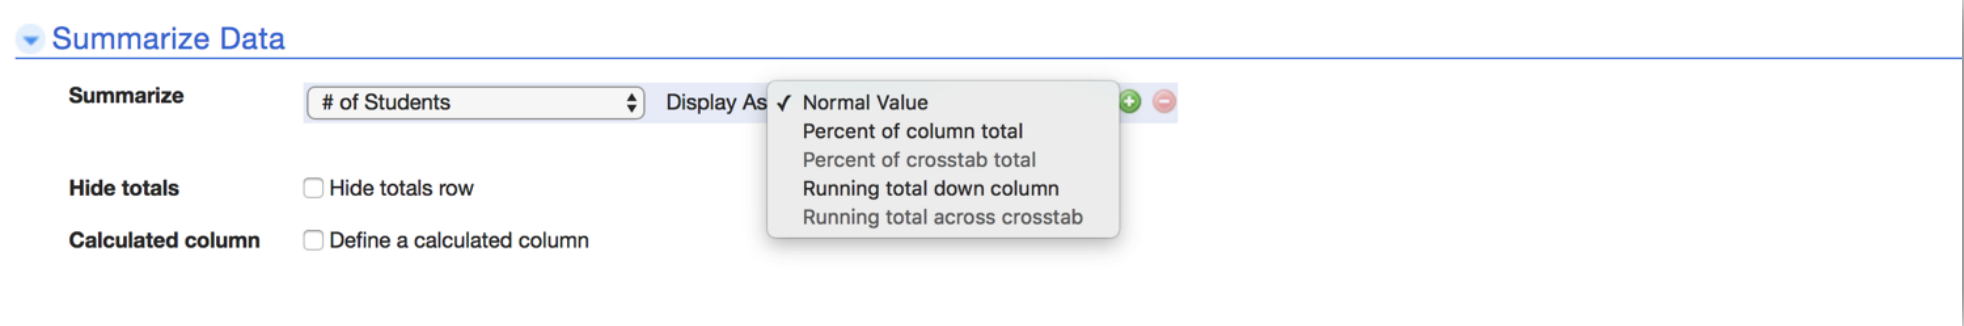
There are more options to represent your data, but these two are the most common.
Selecting How You Would Like to Group
What attribute of your students would you like to total?
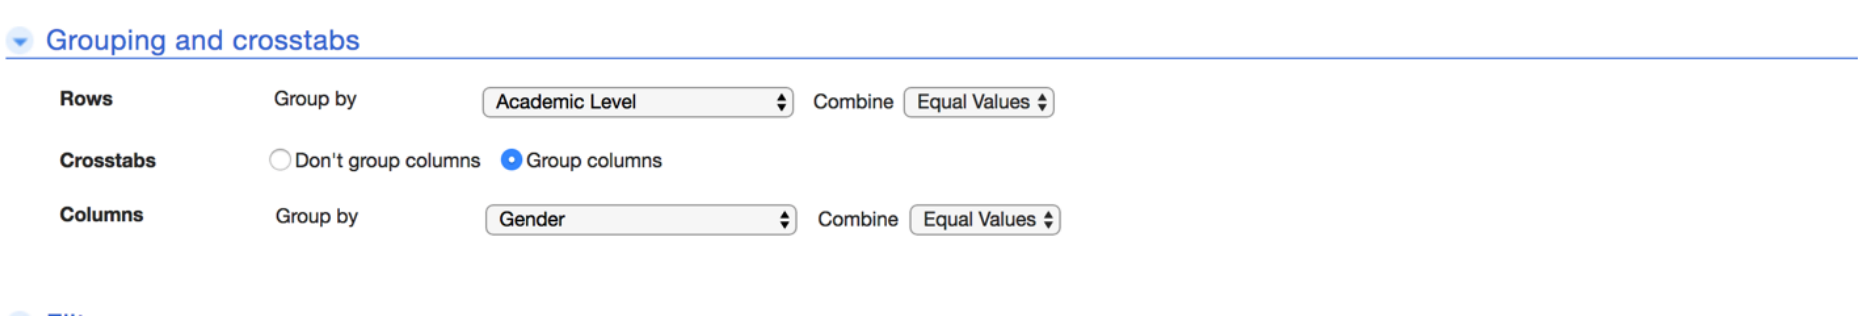
The section named “Grouping and crosstabs” will allow you to select an attribute from your students to group and count. For example, selecting the field (attribute) ‘Academic Level’ will output the total number of students for each Academic level.
Use the 'Rows' drop-down to select the field you would like to use for.
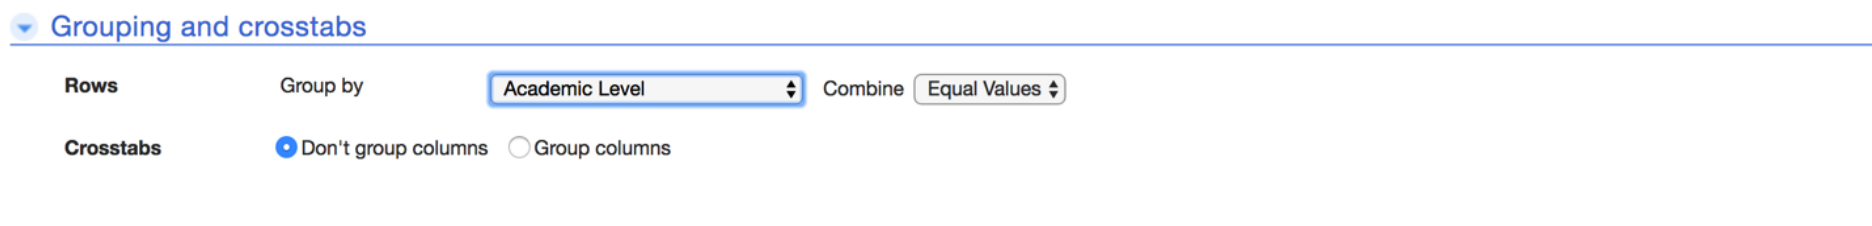
Also, you can group your students twice! Extending on the previous example, selecting to group by 'Academic Level' AND 'Gender' will output a two-dimensional report where each total represents the number of students in each 'Academic Level' and 'Gender.'
Next to ‘Crosstabs’, select ‘Group columns’. This will bring down a new section labeled as ‘Columns’. Use this dropdown to select the field you would like to use.
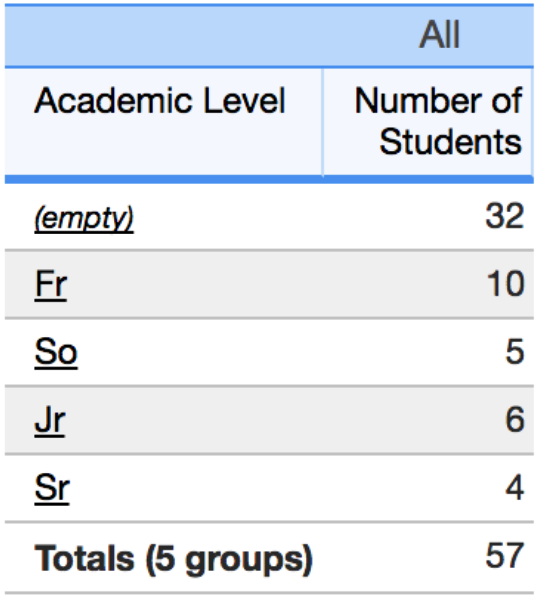
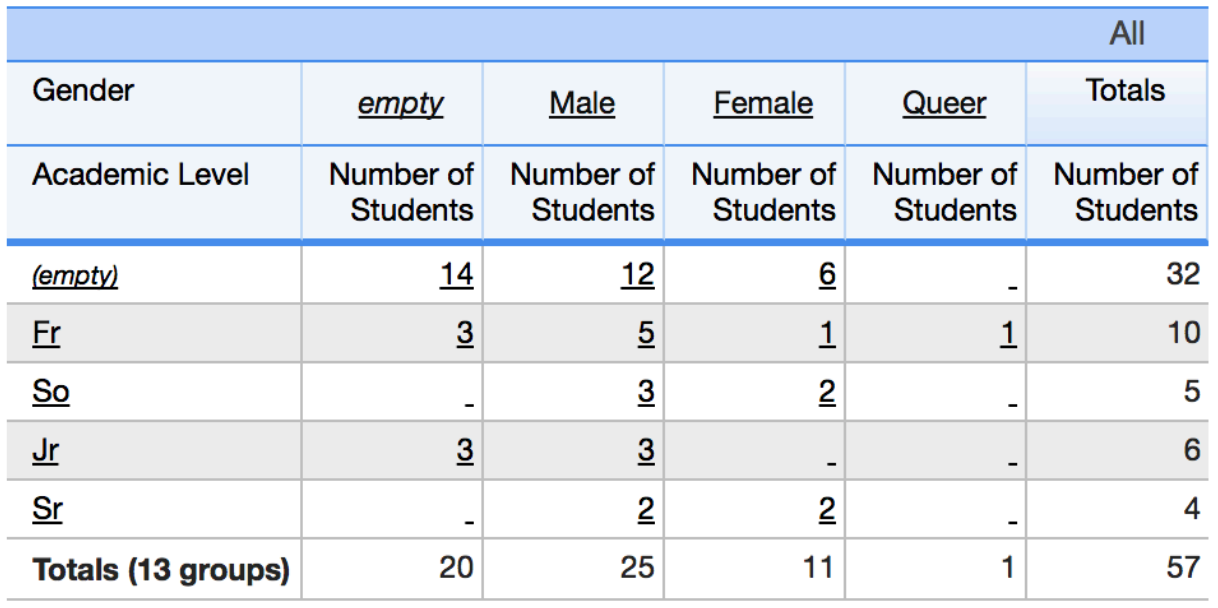
The two images below show the two reports mentioned in the examples above. The report on the left groups by only by 'Academic Level.' The report on the right groups by 'Academic Level' and 'Gender.'
Displaying and Saving your Report
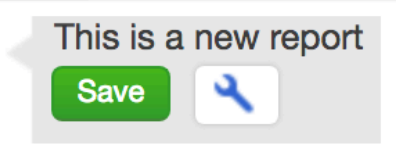
If at any point, you would like to see your report, click on the Display button located on the top-right of the screen. This action will display a non-saved display of the current report. If you are satisfied with this report, you can choose to save it by clicking the save button located above the report. This will save the report underneath the 'Reports & Charts' dropdown. If you wish to continue editing this report, click on the wrench icon located next to the save button.

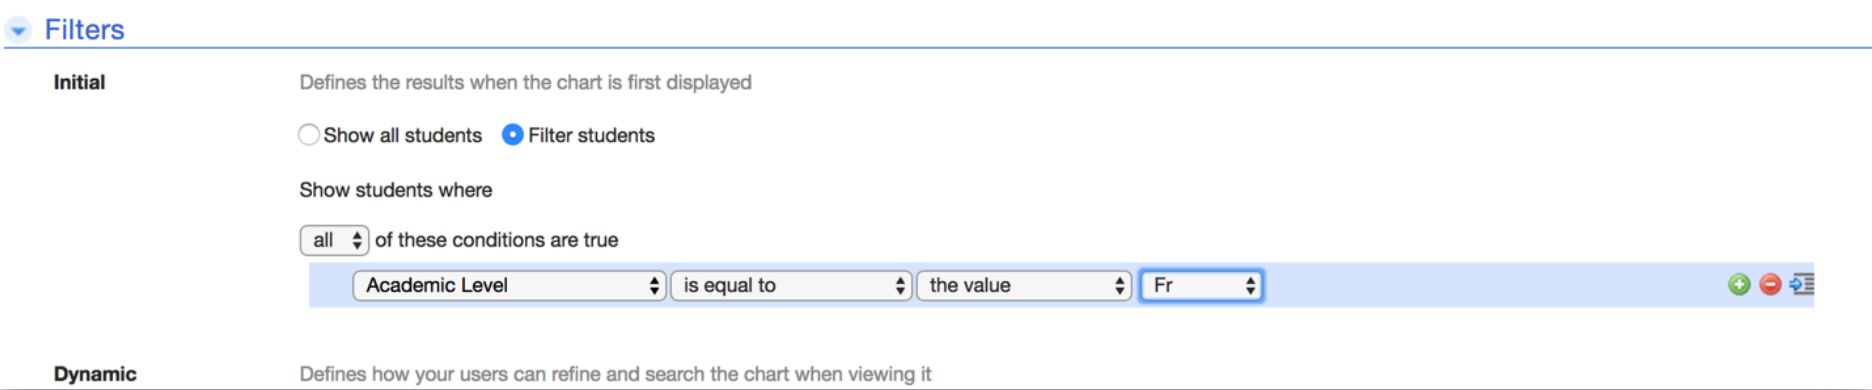
Filtering your Report
You can also filter your results under certain criteria. Filtering your Student report means that only students who have or don't have a specific attribute are counted. Filters are a way you can narrow down your report.
Under the section named "Filters", select 'Filter Students. This action will bring up section where you can choose the logic in which SAM filters your reports.